Need to quickly display xAPI data broken down by learners, activities, or aggregate LRS metrics? Well, we’ve got a graph for that!
In March we announced new documentation and tutorials for Veracity Learning. We’ll be adding more video tutorials over the next few months to our YouTube Channel focused on our LRS, Veracity Learning.
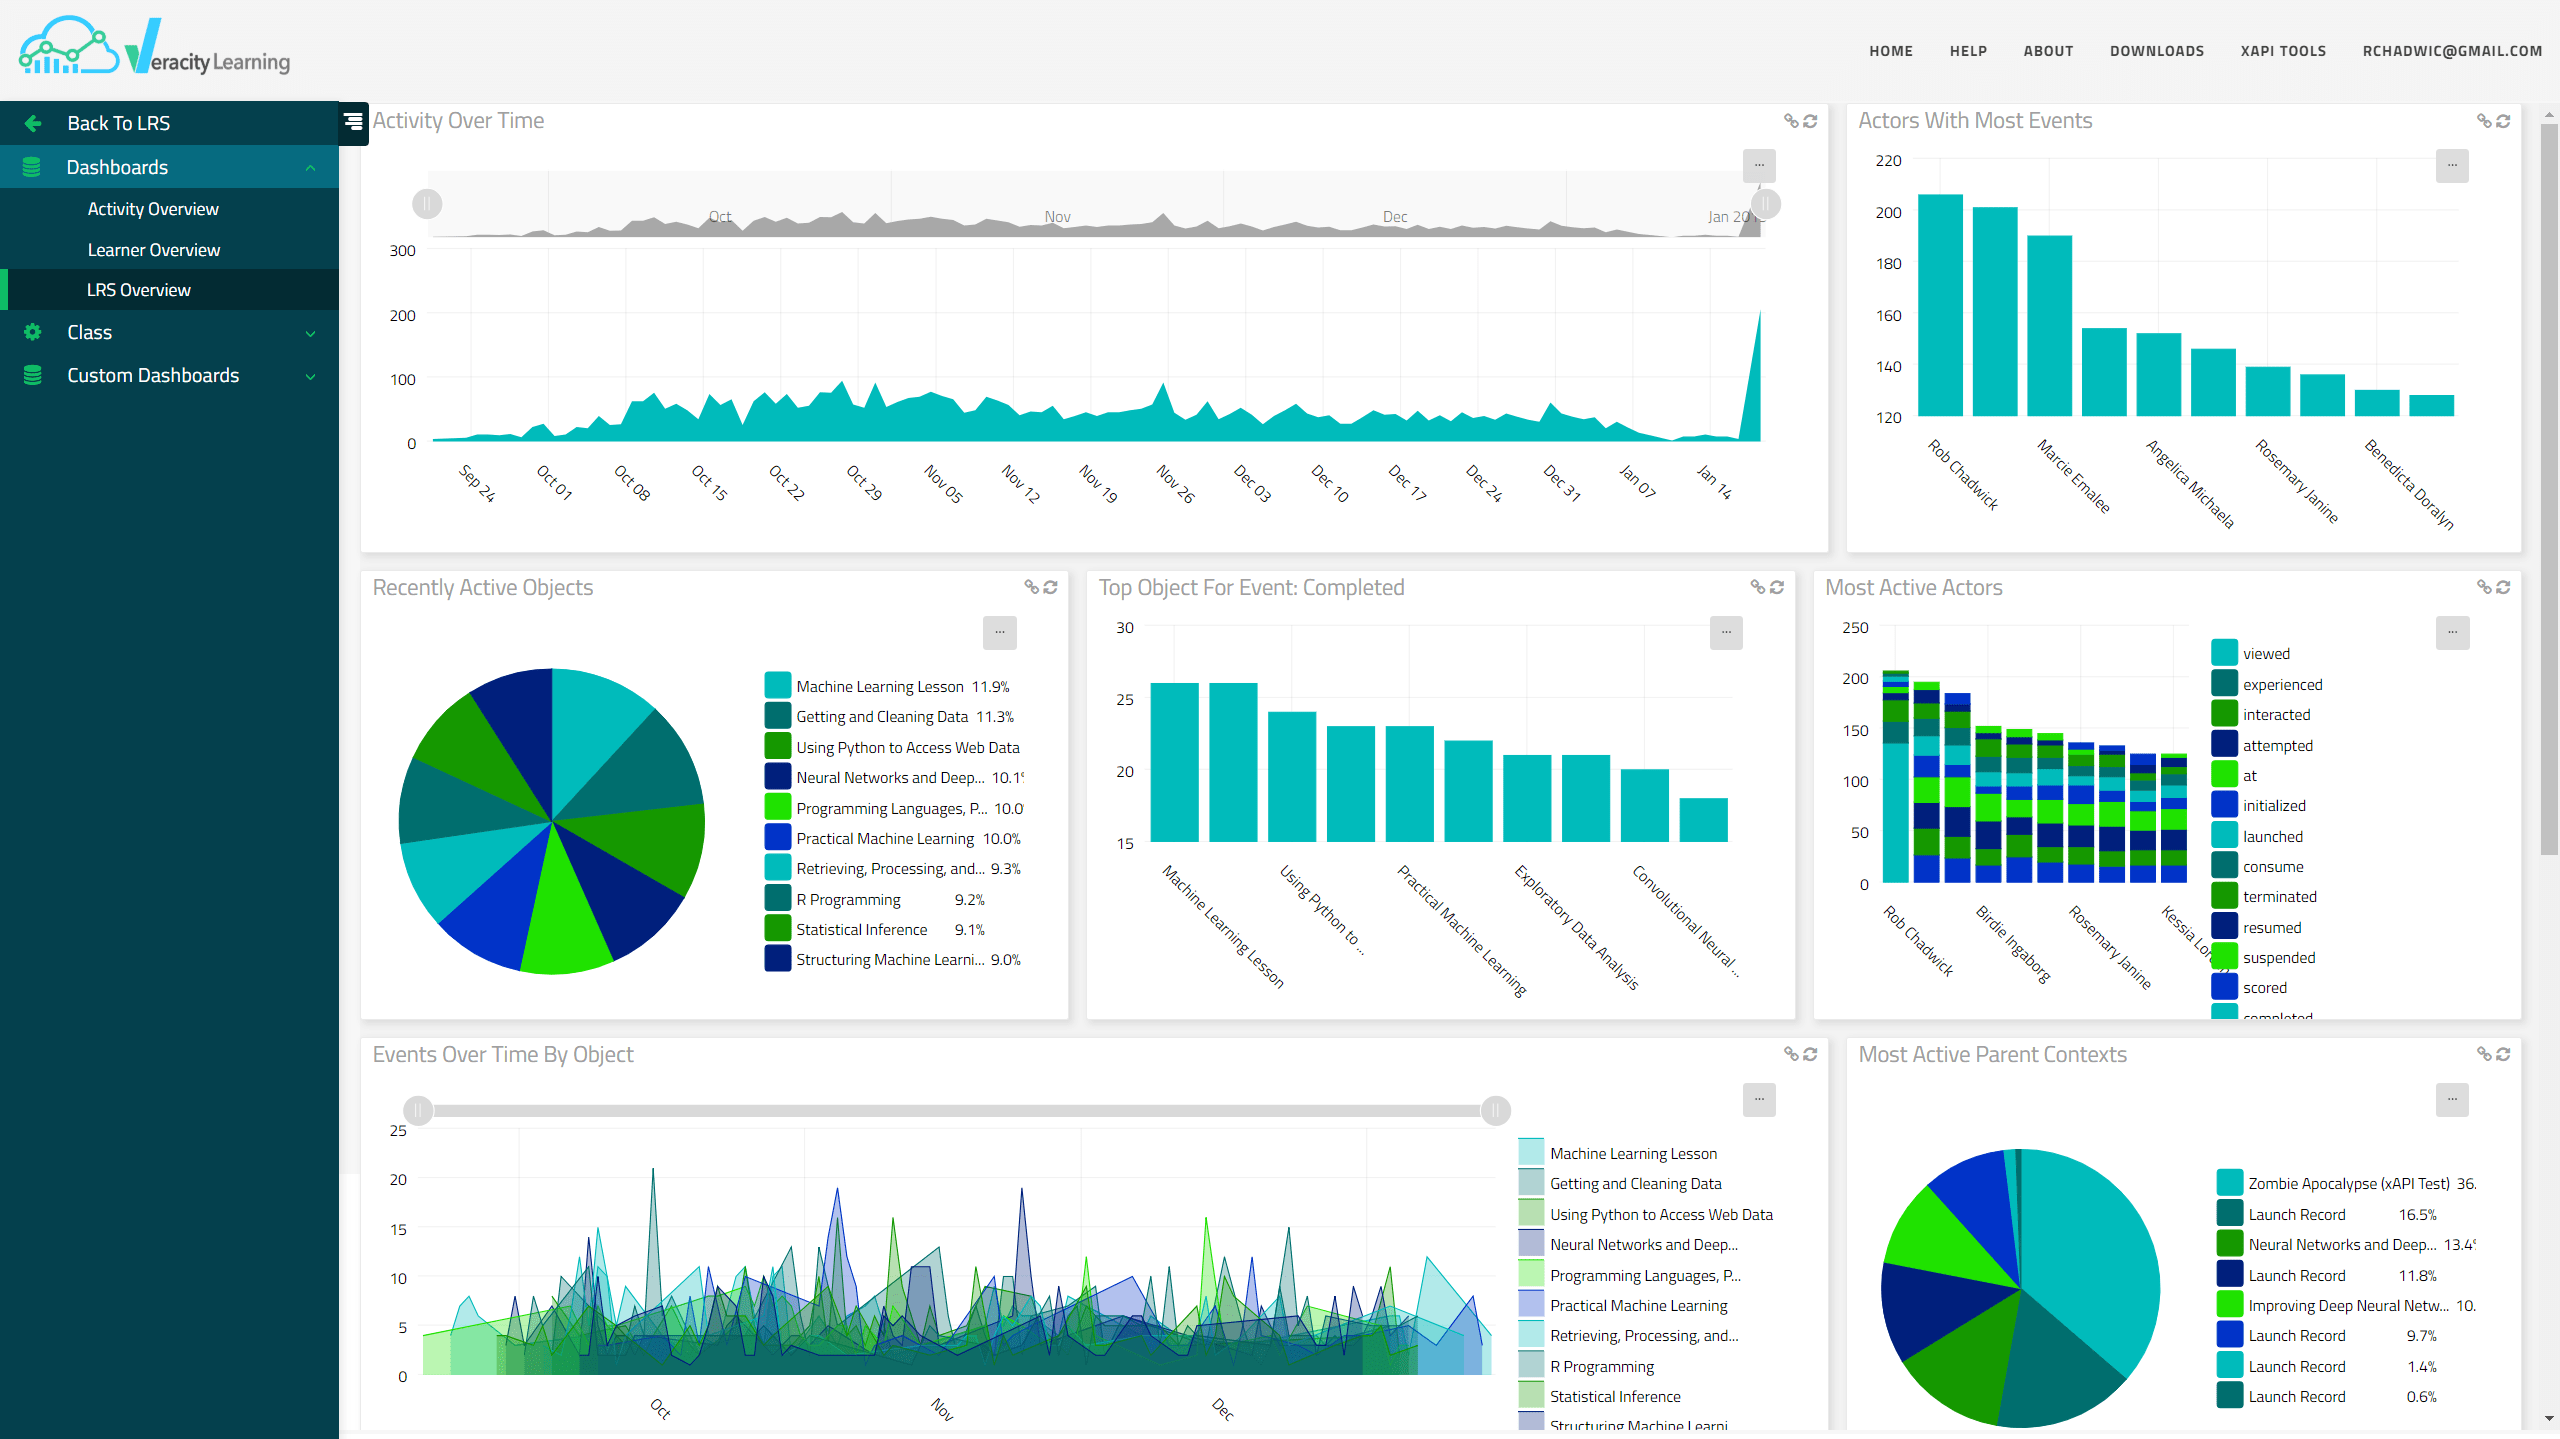
Veracity Learning: LRS Default Dashboards Overview
Watch the tutorial below and join Veracity Learning’s lead architect, Rob Chadwick, as he covers the basics of the dashboard user interface elements and how to distinguish between the different types of default dashboards (Learner, Activity, and LRS). This video tutorial also covers the following:
- Exporting data and images associated with graphs
- Embedding graphs in external web content with iFrames
- xAPI data graphed as parent/child relationships with grouping context
- Importance of modeling xAPI data correctly using the appropriate statement properties
Future tutorials will cover how to create your own custom dashboards, plugins, configure widgets, and write your own aggregation queries within Veracity Learning for even more powerful xAPI analytics.
As usual, please reach out if you have questions, comments, or require support.