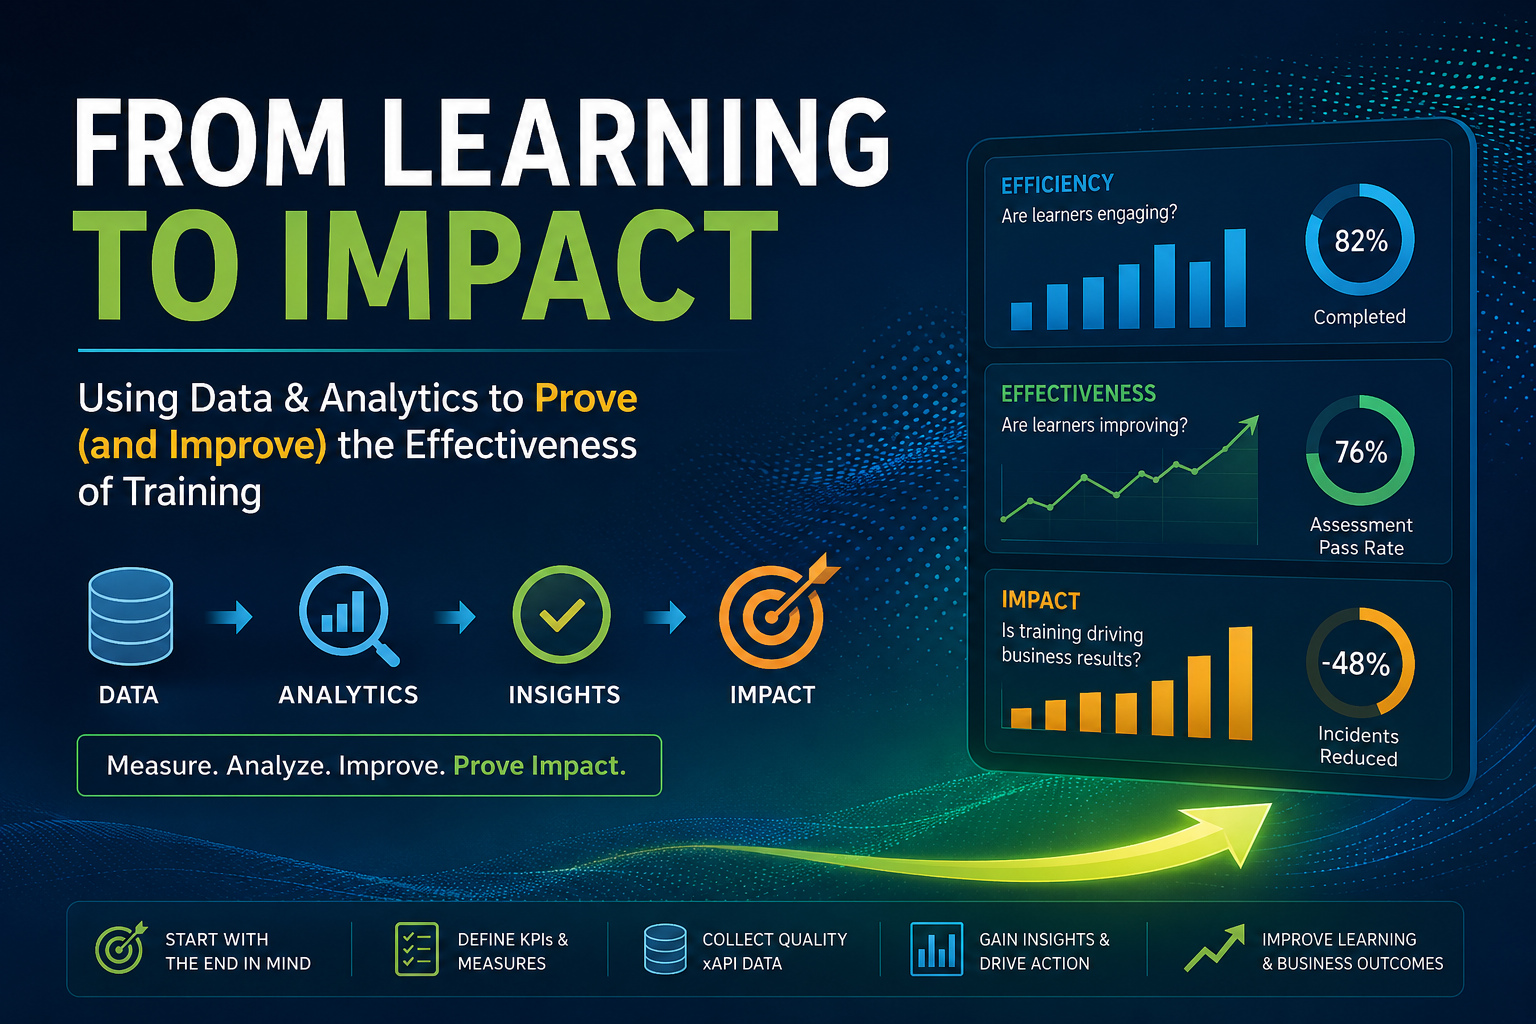
Last month I had the privilege of presenting to the xAPI Collective on a topic I care a lot about: how we can use data and analytics to prove (and improve) the effectiveness of our learning and training solutions.
First, I want to thank the xAPI Collective for inviting me to speak and for continuing to provide such a valuable resource to the learning technology community. The xAPI Collective has become an important place for practitioners, vendors, designers, developers, and learning leaders to come together around real-world uses of xAPI. I’m grateful for the opportunity to contribute to that conversation and applaud the xAPI Collective for bringing exciting topics to help remind us about the importance of xAPI and what it enables.
You can watch the full presentation recording here: Using Data & Analytics to Prove and Improve the Effectiveness of Training
Why I Wanted to Talk About Measurement First
Originally, I was invited to speak about xAPI profiles. That is a topic I enjoy and still think is important. But I suggested this topic instead because I believe there is something even more foundational that needs to happen first.
Before we ask, “What xAPI verbs should we use?” or “What interactions should we track?” we need to ask a few bigger questions:
- What are we trying to prove (and/or improve) with our learning solution?
- Is it a specific type of behavior change?
- Do we want to know if the content is effective?
- Do we want to know if implementing the solution is making an impact on business or human performance?
These types of questions should drive the data strategy and what you will measure with xAPI.
By the way, if you would like to learn about xAPI Profiles, register for Matt Kliewer’s upcoming presentation (“Why xAPI Profiles Matter: From Data Chaos to Structured Learning Evidence”).
I have seen many organizations get excited about xAPI because of what it can collect. That excitement is understandable. xAPI gives us a much more flexible way to capture learning and performance data beyond the LMS, including data from simulations, videos, mobile apps, performance support tools, assessments, and even real-world activities.
But more data does not automatically mean better insights.
If the data is not tied to an evaluation strategy, it often becomes noise. It may tell us that activity happened and was completed, but not whether the learning or training solution actually made a difference.
Evaluation Should Not Be an Afterthought
One of the main points I emphasized in the presentation is that evaluation needs to happen earlier in the process.
Evaluation is the “E” in ADDIE, but it is often one of the most neglected parts of the model. Too often, the content is quickly designed, developed, launched, and then maybe someone asks later whether it worked. By then, the budget may be gone, the project team may have moved on, and the opportunity to build meaningful measurement into the solution has passed.
I think we need to flip that around.
Evaluation should inform the analysis and design phases. It should help us decide what data we need, what success looks like, and what stakeholders will need to see later. It should also create feedback loops so we can improve the learning experience over time.
In other words, evaluation is not a “one and done” event. It should be continuous and iterative.
Start With the End in Mind
A simple way to approach this is to start with the end in mind.
Before building dashboards or configuring xAPI statements, ask:
- What business or mission goal is this training designed to support?
- Who are the stakeholders and decision-makers?
- What do they need to know?
- What would count as evidence of success?
- What data would help us improve the solution after launch?
Evaluation frameworks like Kirkpatrick, Phillips ROI, TDRp, ISO 30437, and LTEM can help structure this thinking. I do not think the specific framework matters as much as the discipline of using one. These models help us think beyond completion and satisfaction data and toward knowledge, behavior, transfer, performance, and business impact.
A useful way that TDRp/ISO 30437 proposes to organize measures is into three categories:
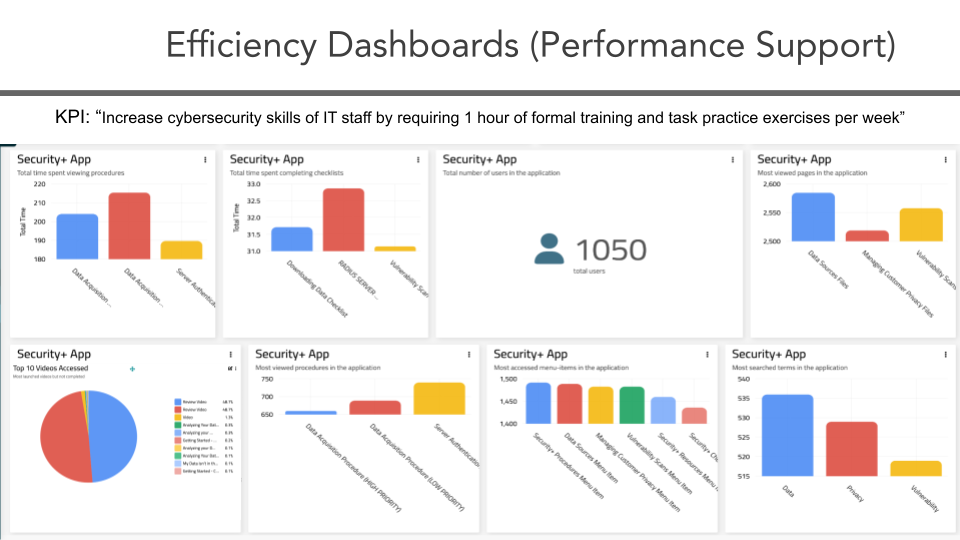
Efficiency measures help us understand usage, reach, access, volume, and time. These include things like completions, page views, time spent, search terms, checklist completions, and video segments viewed.
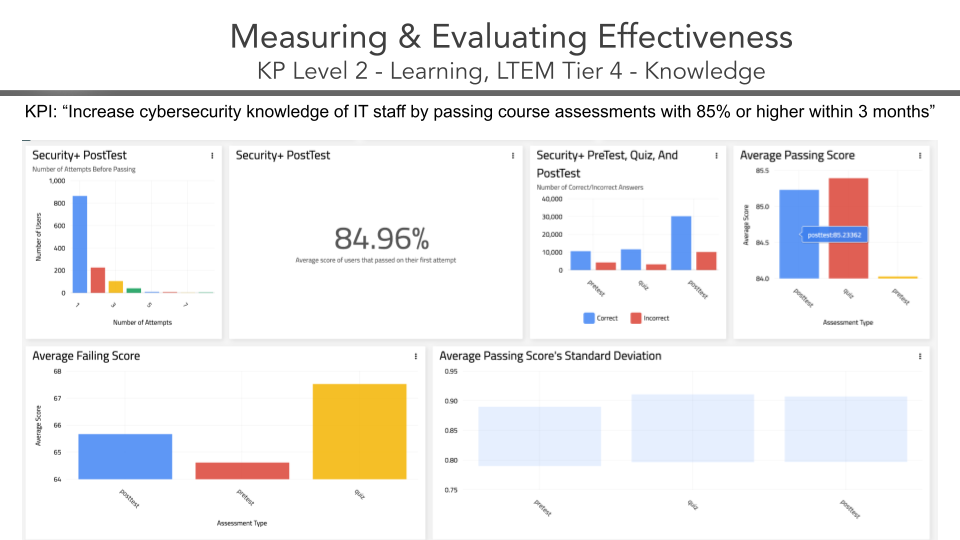
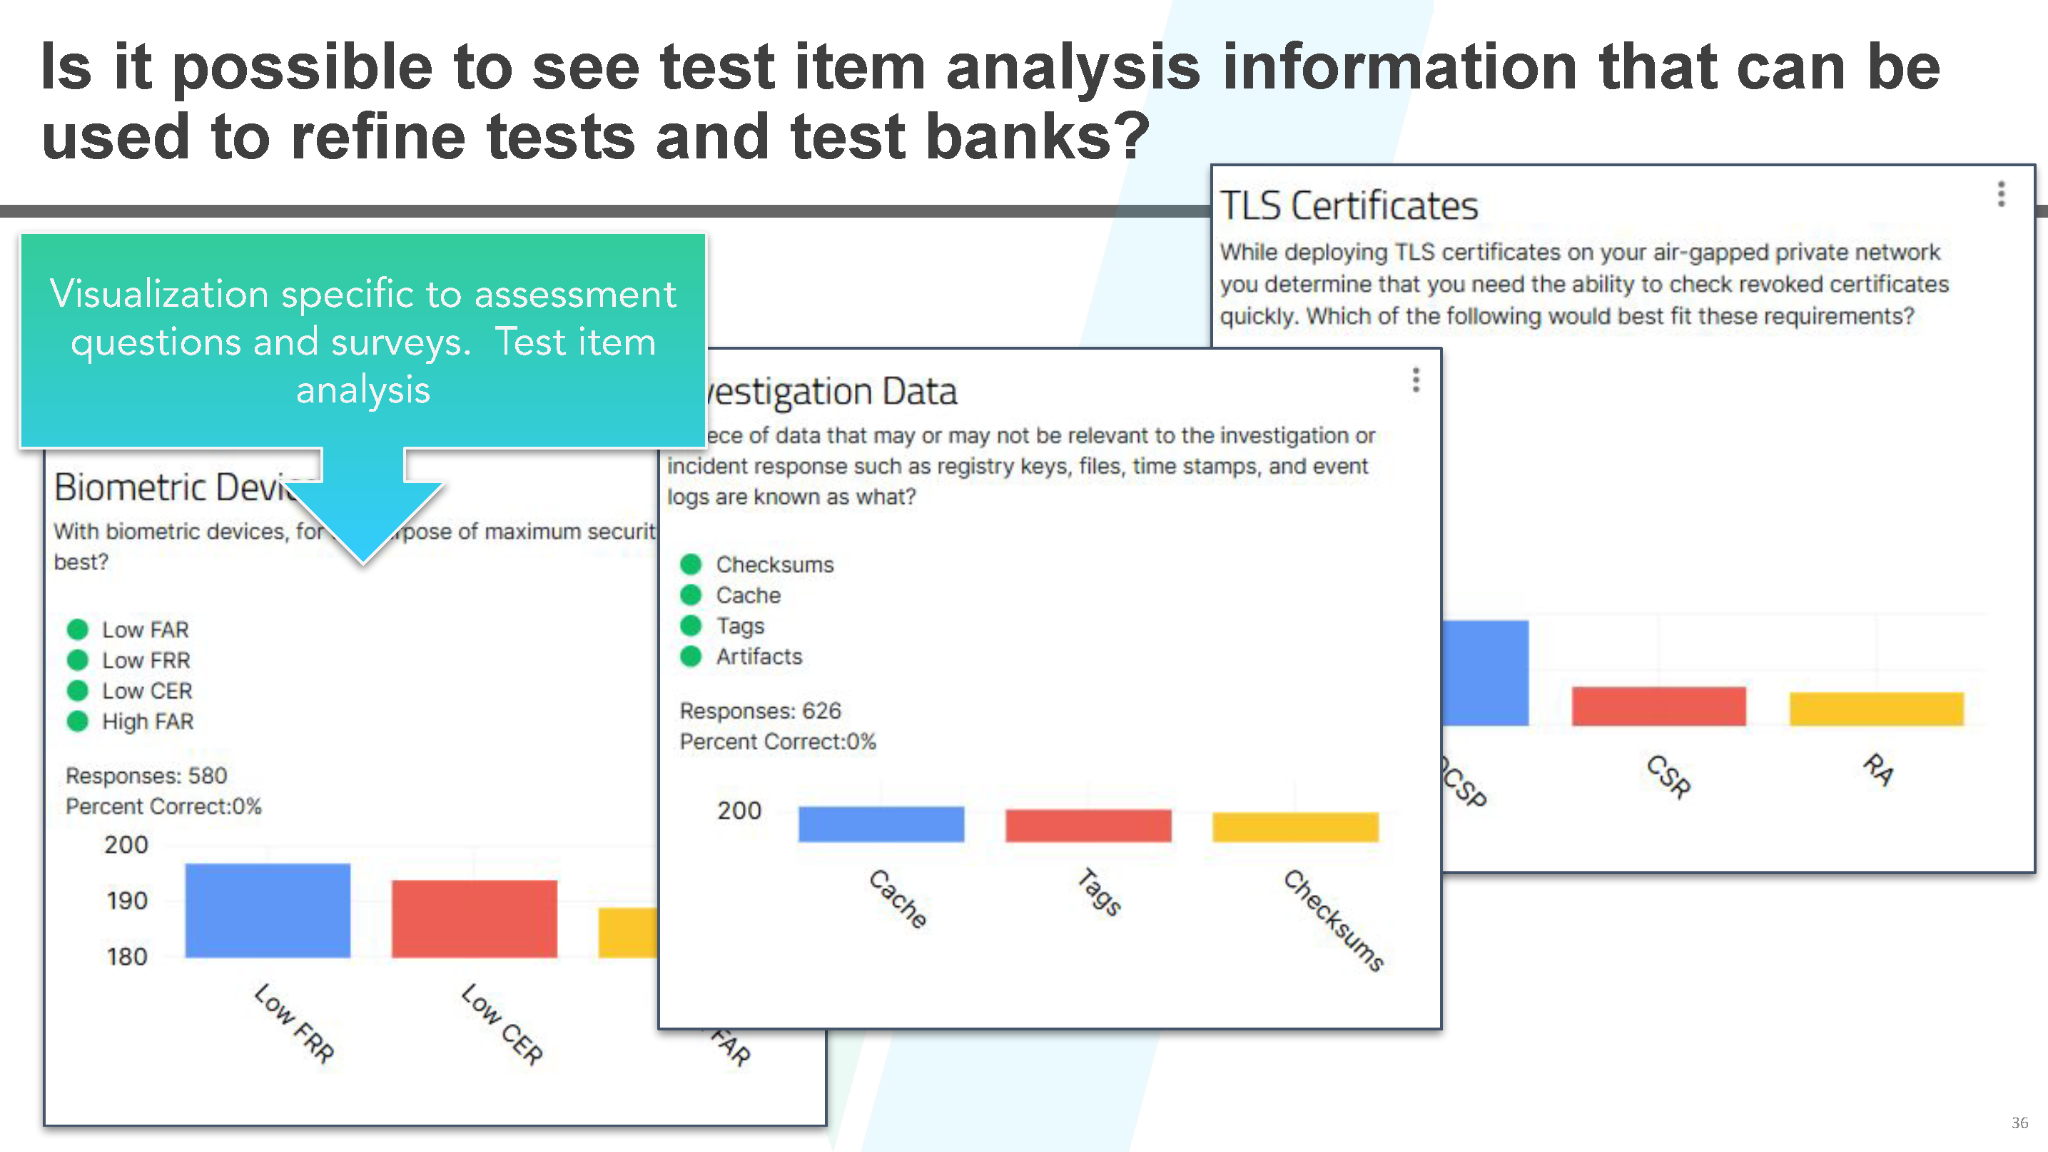
Effectiveness measures help us understand learning quality, knowledge, skill, confidence, assessment results, and transfer. These include pass rates, scores, pre/post comparisons, attempts before passing, test item analysis, and self- or supervisor-reported confidence.
Outcome/Impact measures help us connect learning to business outcomes, such as cost, compliance, readiness, productivity, safety, customer satisfaction, retention, or reduced incidents.
Most L&D teams are familiar and comfortable with efficiency data. Many are also measuring some basic forms of effectiveness with surveys. The harder (and more valuable) work is connecting learning data to impact.
KPIs Make the Strategy Clearer
One of the best ways to clarify what should be measured is to express goals as KPIs.
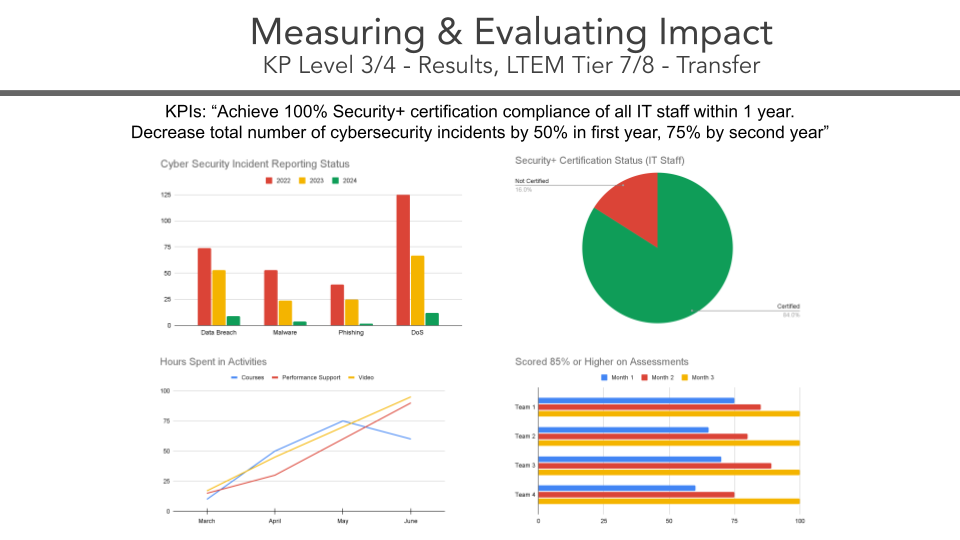
In the presentation, I used a cybersecurity example. Imagine a CIO wants to improve the cybersecurity preparedness of internal IT staff to reduce recurring incidents like data breaches or cyber attacks.
A SMART goal might be:
Decrease the number of cybersecurity incidents by increasing IT staff knowledge, skills, and performance, and achieve 100% Security+ certification of IT staff.
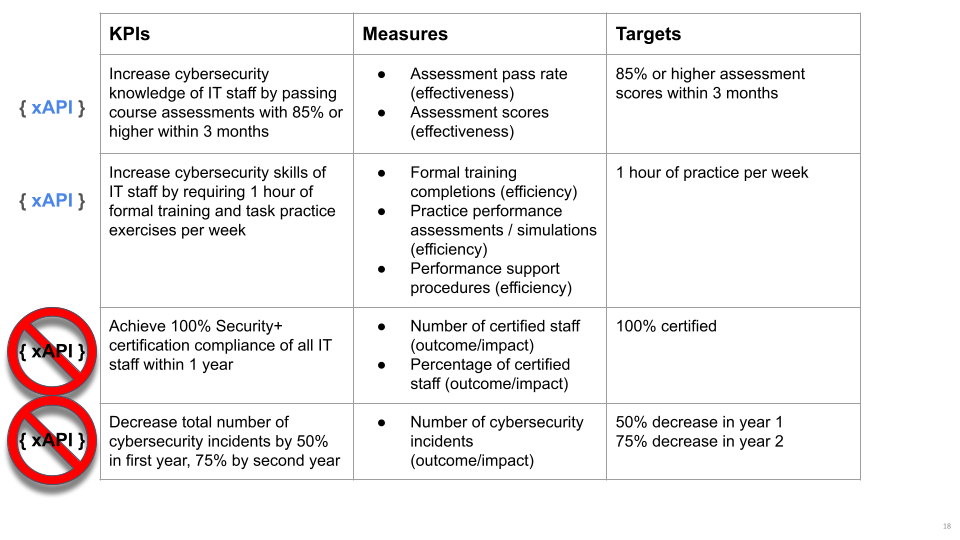
That goal can then be translated into KPIs, such as:
- Increase cybersecurity knowledge by having staff pass assessments with 85% or higher within three months.
- Increase cybersecurity skills by requiring one hour of formal training and task practice each week.
- Achieve 100% Security+ certification compliance within one year.
- Decrease cybersecurity incidents by 50% in the first year and 75% by the second year.
Once those KPIs are defined, the measurement strategy becomes much clearer. We know what learning data we need, what business data we need, and how dashboards should be organized.
Dashboards Should Tell a Story
Dashboards are most useful when they tell a measurement story.
An efficiency dashboard might show whether learners are spending enough time in practice activities or performance support resources.
An effectiveness dashboard might show whether learners are improving through assessments, simulations, or pre/post comparisons.
An impact dashboard might show whether business outcomes are moving in the right direction as learning activity and performance improve.
That is the shift we need to make: from “Did they complete the training?” to “Is the training helping improve performance and business results?”
Not all of that data will come from xAPI, and that is okay. xAPI may capture learning activity, simulations, performance support usage, and assessment data. Certification data may come from a third-party provider. Incident data may come from a help desk or ticketing system. The real power of using data and analytics comes from evaluating all of those data sources together and monitoring the progress toward achieving your goals.
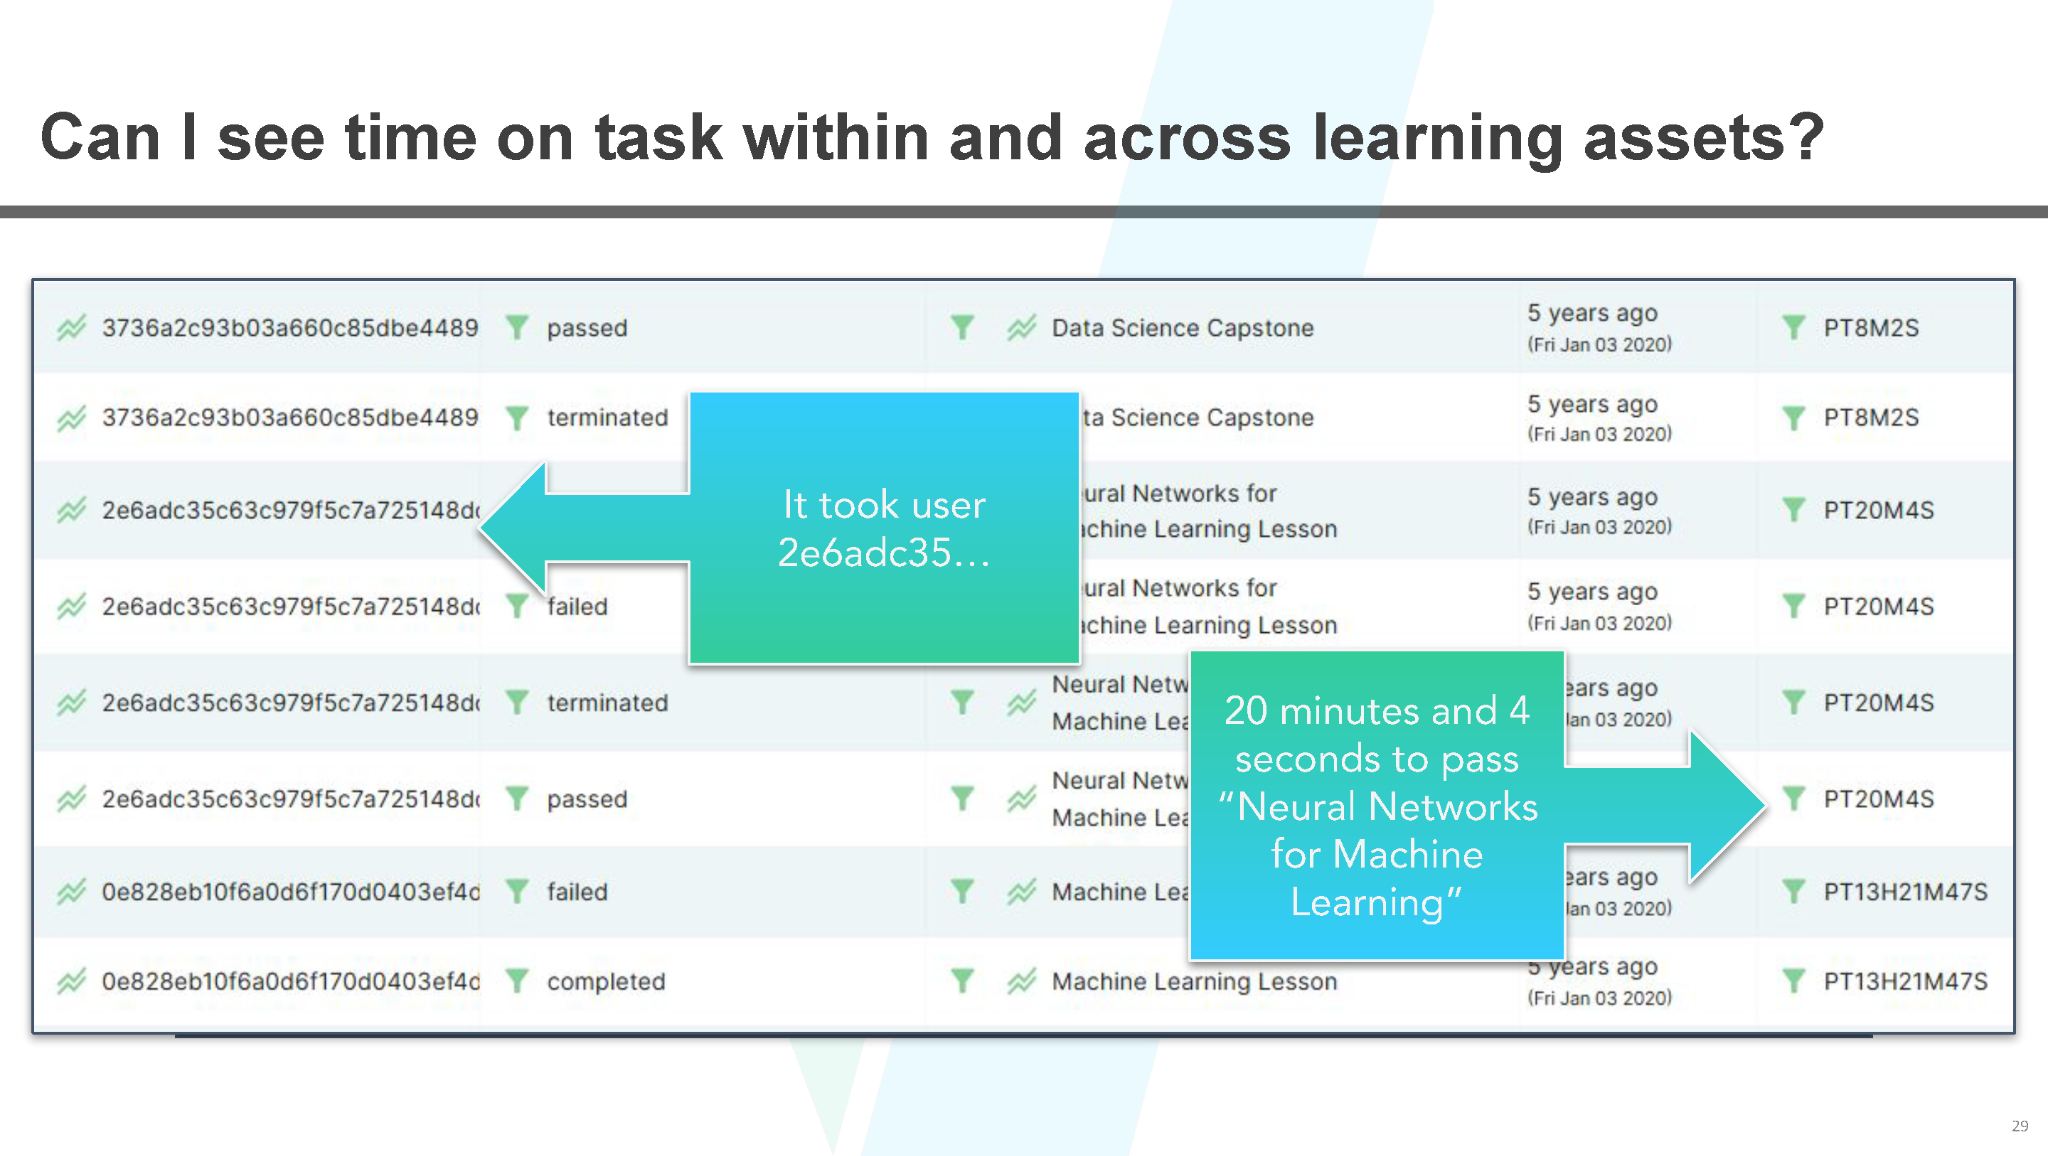
Data Can Also Improve the Learning Experience
Another point I wanted to emphasize is that analytics are not just for proving value to stakeholders. They are also for improving the learning experience itself.
Time-on-task data can show where learners may be moving too quickly or getting stuck.
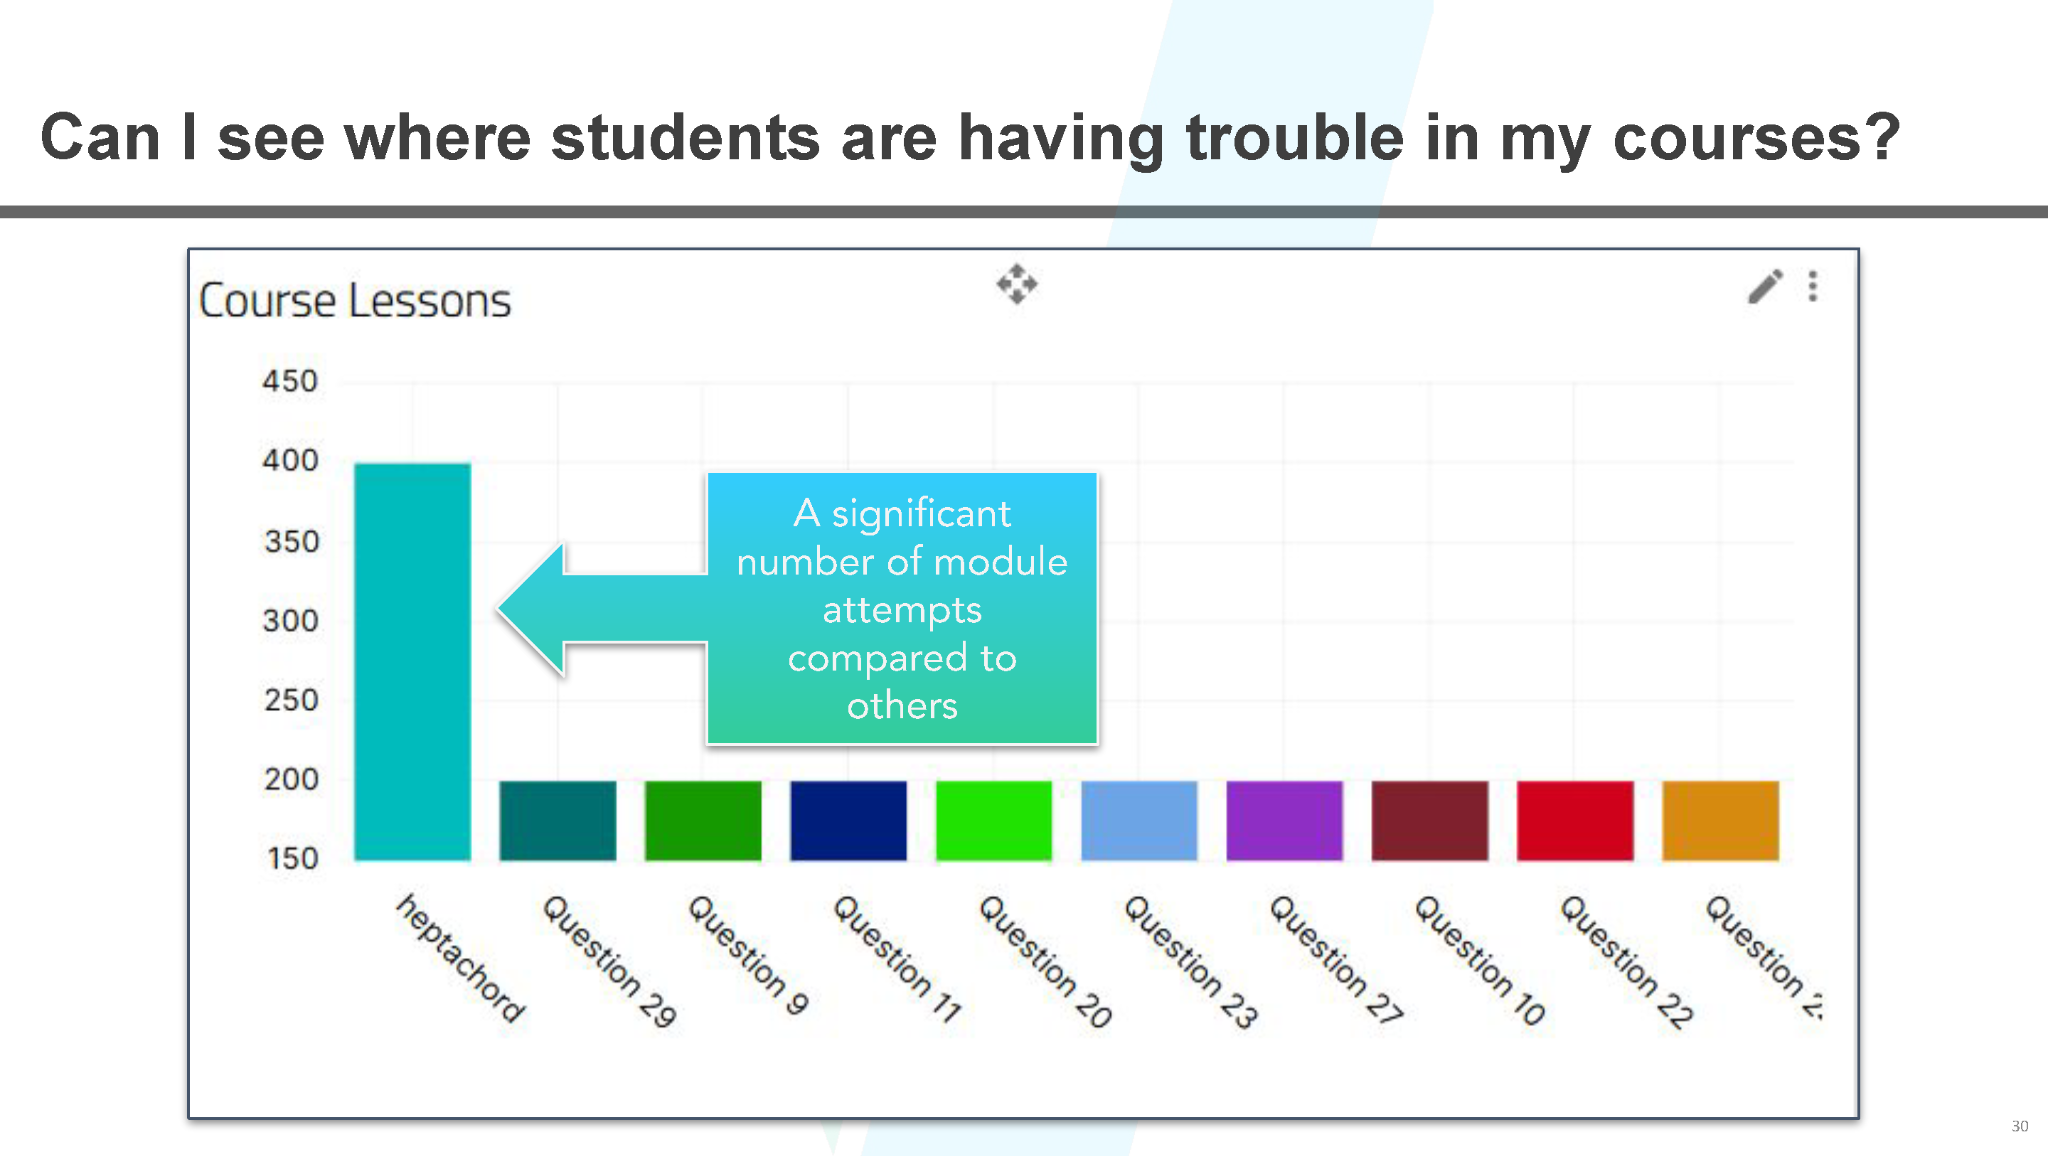
Attempt data can reveal modules or activities where learners are struggling.
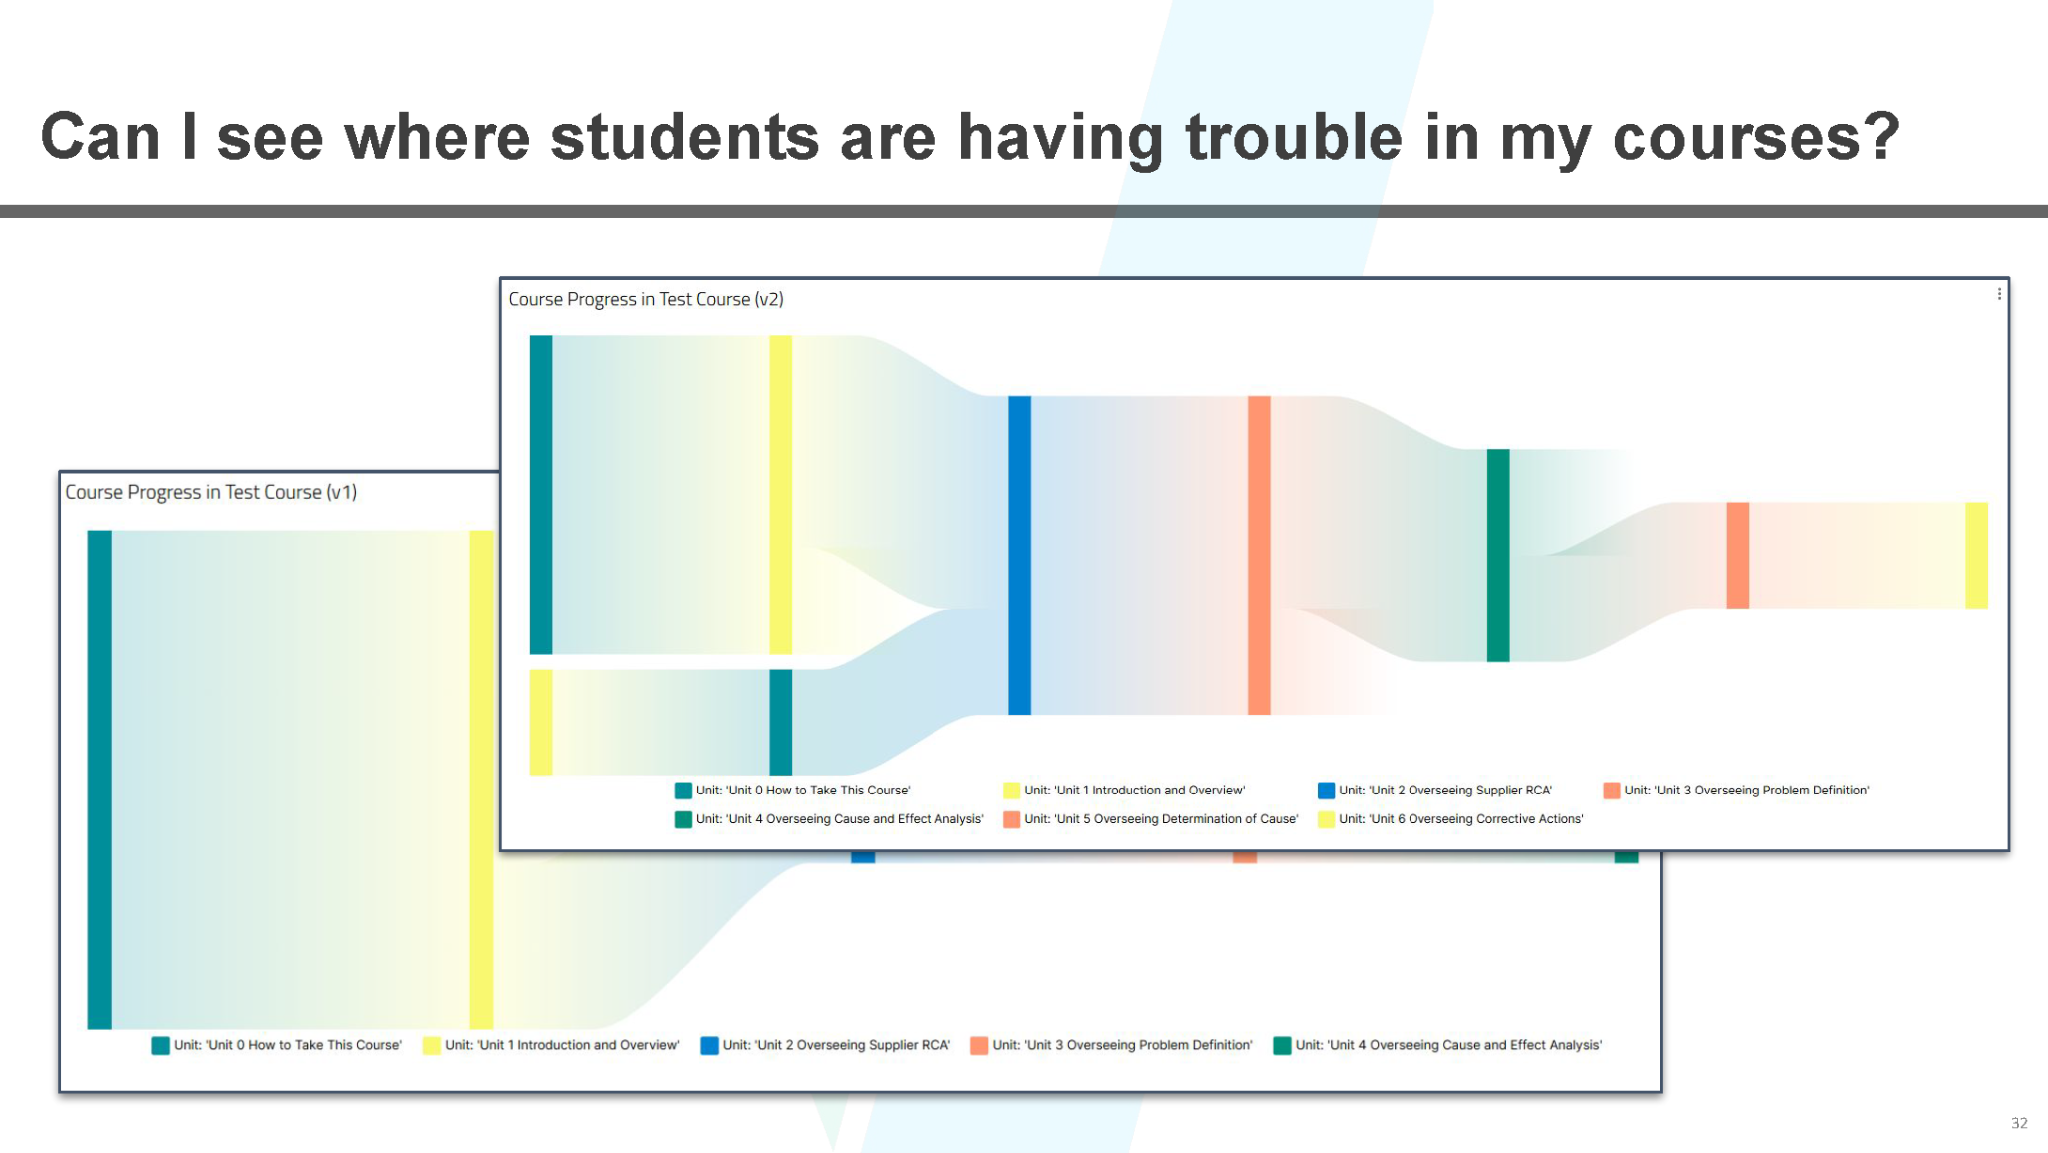
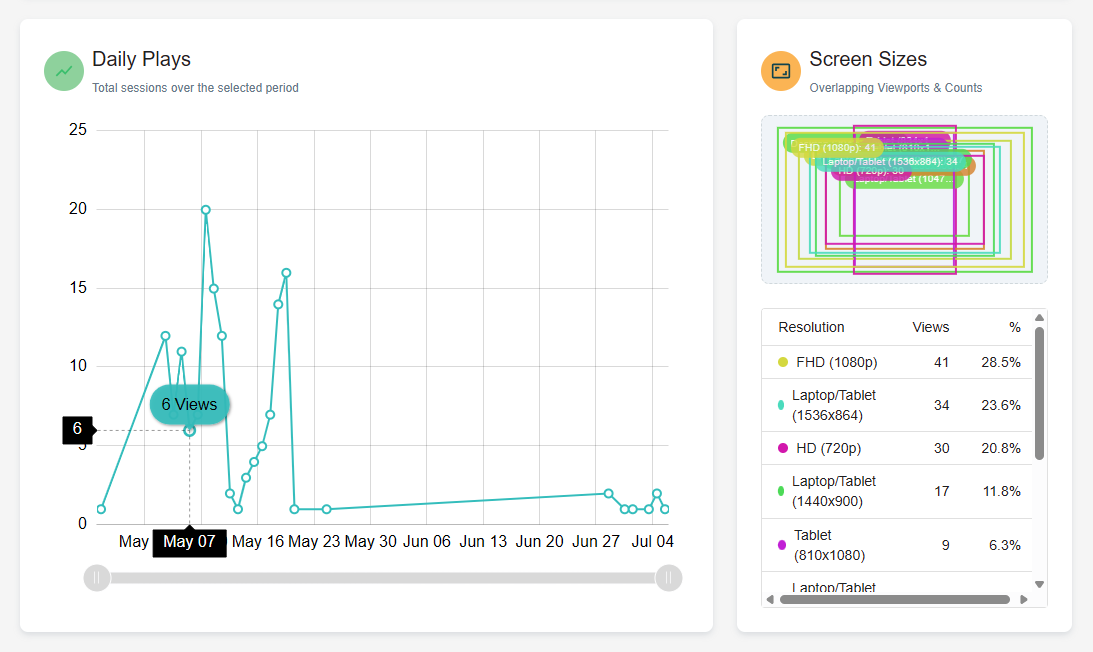
Path analysis can show how learners move through content and where they may be dropping off.
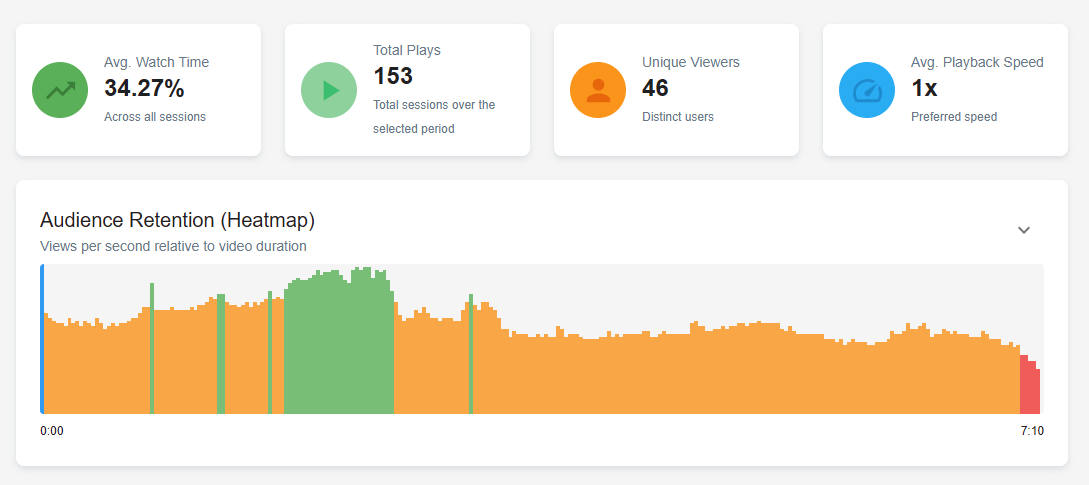
Video analytics can show whether people are actually watching the videos we produce, where they pause, what they replay, and what they skip.
Assessment analytics can help identify confusing questions, weak distractors, or content that may need to be reinforced.
These insights give instructional designers, learning leaders, and performance consultants a better way to refine content over time.
AI Can Help, But Data Quality Still Matters
I also spent some time discussing AI because there is so much interest in using AI tools for learning analytics.
AI can help summarize charts, identify patterns, explain trends, and support data storytelling. That is exciting. But AI does not remove the need for a sound data strategy.
The old adage still applies: garbage in, garbage out.
If your xAPI data is inconsistent, poorly structured, or not aligned to your measurement goals, AI tools will have limited value. Clean, structured, conformant xAPI data stored in an LRS gives you a much stronger foundation for both traditional analytics and AI-assisted analysis.
AI can help accelerate the process, but human judgment is still required. The tools can surface observations. Your team still owns the interpretation, the conclusion, and the action.
Final Thoughts
The main message I hope people take away from the presentation is this:
Do not start with the tool. Start with the outcome.
xAPI is powerful, but it is not the strategy. Dashboards are useful, but they are not the strategy. AI can help, but it is not the strategy either.
The strategy begins with the end in mind (evaluation).
When we start with the end in mind, define meaningful KPIs, collect the right data, and build dashboards around the decisions we need to make, we can do so much more than simply report on training activity and course completions.
We can prove whether a learning or training solution is working.
We can improve the learning experience.
And we can better connect learning to performance and business impact.